climate
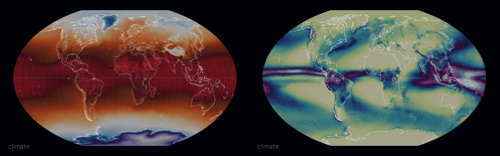
a high-resolution animated interactive global map
of present and possible future climate
data and visualisation produced by the climate data factory
with support from the Copernicus Climate Change Service and
through project High-resolution climate projections
A TCDF-aligned climate hazard dataset for climate related financial disclosures
Displayed Data
"future" conditions are from a worst case scenario
with no effort to reduce greenhouse gas emissions
(Representative Concentration Pathway 8.5 of IPCC)
as simulated by and averaged from four climate models
the data represent conditions at near ground or water level
a layer that follows the contours of the sea, valleys, mountains, etc.
| Temperature | Temperature at 2 meter above ground |
| Precipitation | Total precipitation (water and/or snow) at ground surface |
Keyboard Shortcuts
| e | ukaž menu |
| escape | zavři dialog/menu |
| n | přepni na teď (nejnovější údaje) |
| shift-c | show the date selection calendar |
| j | jdi vzad po jednom kroku |
| shift-j | jdi vzad po několika krocích |
| k | jdi vpřed po jednom kroku |
| shift-k | jdi vpřed po několika krocích |
| g | Zapnout/vypnout mřížku |
| p | zapnout/vypnout animaci |
| shift-h | zapnout/vypnout mód vysokého rozlišení (HD) |
| shift-t | show settings |
| i | vystoupat o jednu tlakovou hladinu |
| shift-i | vystoupat ke stratosféře |
| m | sestoupit o jednu tlakovou hladinu |
| shift-m | sestoupit k povrchu |
| d | zoom in |
| shift-d | zoom in faster |
| x | zoom out |
| shift-x | zoom out faster |
| w | rotate up |
| shift-w | rotate up faster |
| z | rotate down |
| shift-z | rotate down faster |
| a | rotate left |
| shift-a | rotate left faster |
| s | rotate right |
| shift-s | rotate right faster |
Credits
| Inspired and adapted from | earth.nullschool.net |
| Open version of code | github.com/cambecc/earth |
| Hosting | Amazon S3 |
| CDN |
CloudFlare |
| Color Scales |
ColorBrewer2.org |
terms of service apply
Copyright (c) 2023 the climate data factory